As an entrepreneur, you can’t afford not to know the latest branding statistics with all of the competition you face out there.
These statistics are valuable to you and your business, because they show what others have done — helping you learn from their trial and error. In this post, I’ve collected stats that’ll help you avoid mistakes and give your brand — or personal brand — an edge over the competition.
So let’s dive in!
77 Branding Statistics You Need to Know

General Branding Statistics
At least 81% of consumers need to trust the brands they buy from. They’re looking for a better customer experience and for companies to understand their needs. Today, fewer than 25% of people trust the labels on the foods they buy, and this mistrust of brands has become a real issue.
When people are asked the most important brand attribute, 31% of consumers chose trustworthiness, 29% put creativity at the top and 22% voted for authenticity.
Let’s hear it for being 100% you!
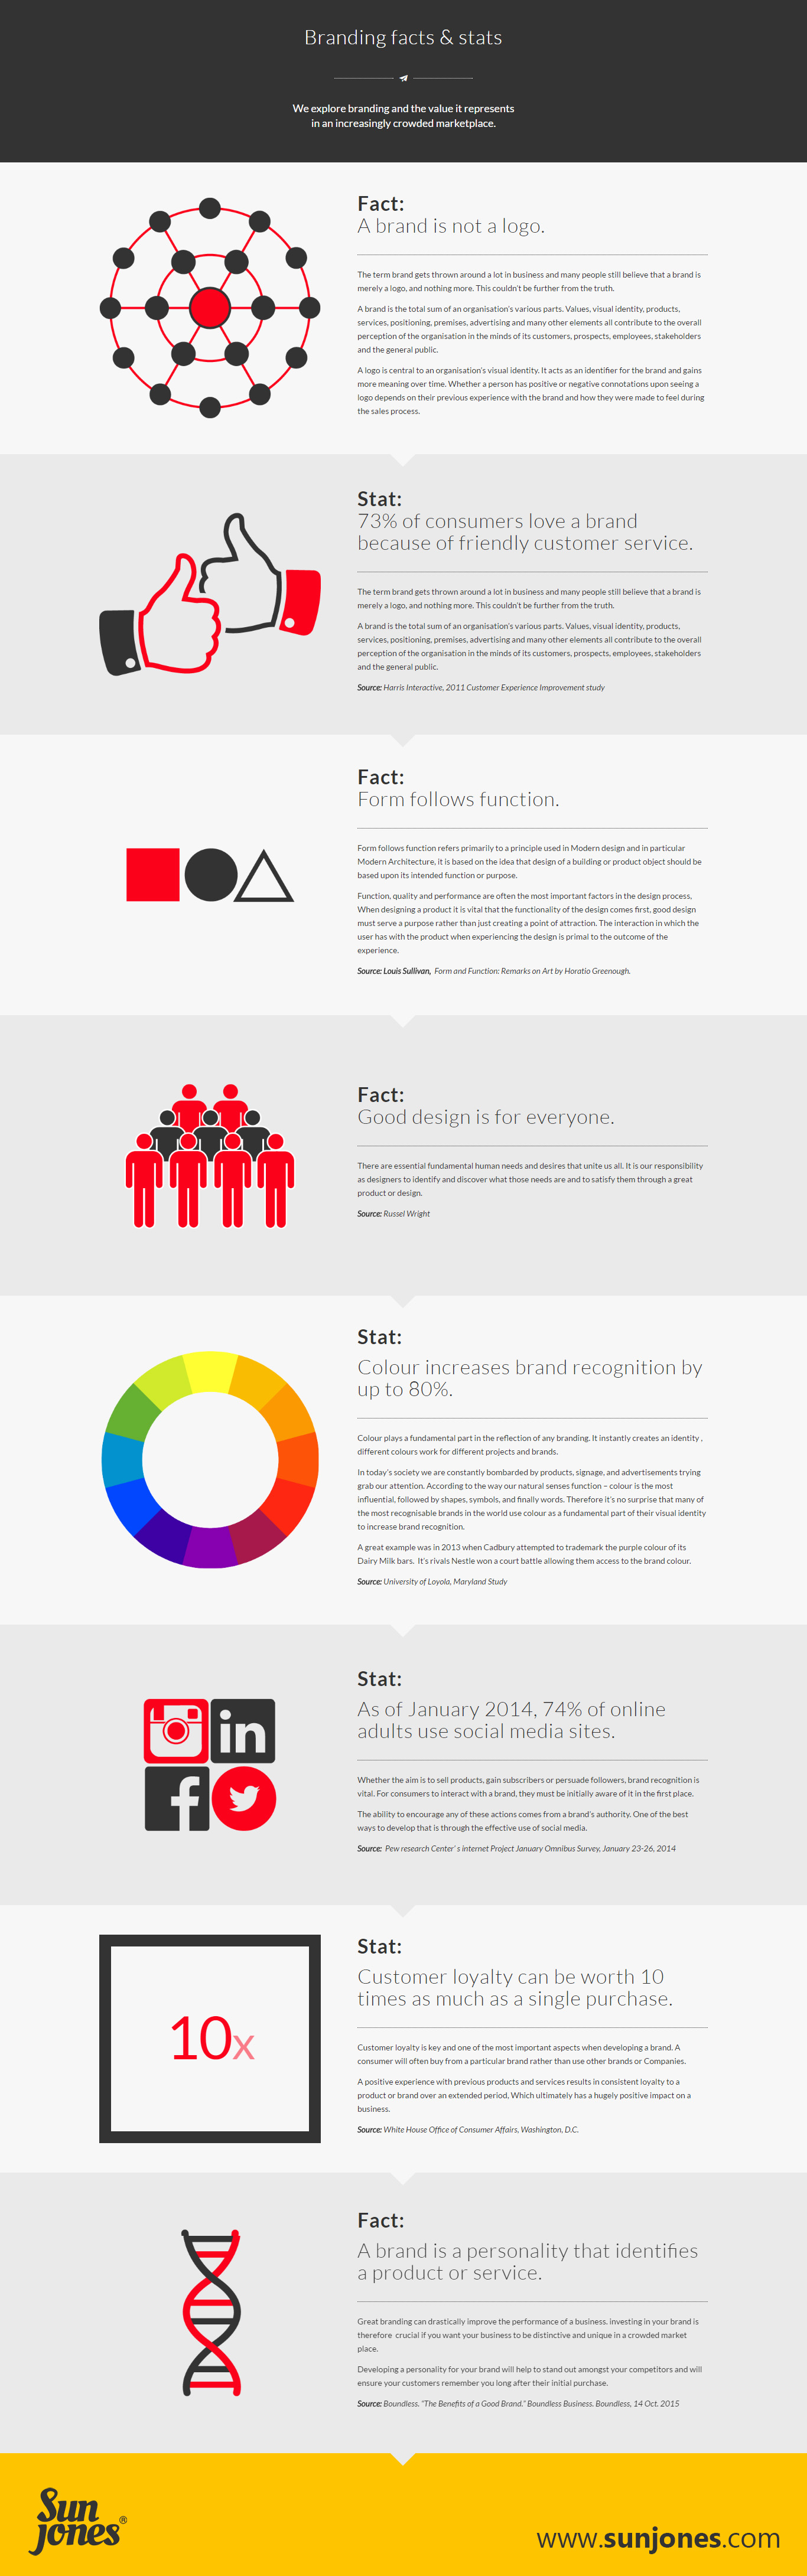
Before becoming loyal to one brand, 91% of consumers look for authenticity and 73% look for friendly customer service.
Did you know it typically takes 5 to 7 interactions for a consumer to remember a brand? (And what they remember most is the overall impression you made.)
Consistency is key when you want to reach your customer and make an impression!
When you do this, customers who form an emotional connection with an authentic brand stay with them an average of 5.1 years versus 3.4.
An added bonus, customers who form an emotional connection with brands, recommend those brands at a much higher rate: 71% vs 45%.

Statistics on Brand Consistency
Consistent branding across all channels (organic, social, video, advertising, etc.) is a bare minimum requirement for 60% of millennial consumers. Creating formal brand guidelines will definitely help with this consistency, which is why 95% of companies have them…
But unfortunately, only 25% of those companies actually stick to them.
You want to present yourself — and your brand — the same way on every channel so your target audience can clearly see who you are and what’s important to you. The last thing you want is for your potential customers to be confused.
Knowing this, it’s a big deal that 60% of B2B brands report their content or visuals don’t follow their brand guidelines. Those companies should take note of organizations that prioritized consistent branding — they’ve seen at least a 33% increase in revenue.
When you’re consistent (and seeing bigger returns), it’s because of your transparency… people want to know what to expect from you. In fact, transparency is so important to consumers, two-thirds (66%) of them see it as one of the most attractive qualities of a brand.
And when companies are transparent and customers see they share their values, 77% are more likely to buy from those brands.
That said, being transparent about your values can have both its pluses and minuses…
- 64% of consumers around the world say they would buy from or boycott a brand solely because of its stated position on a social or political issue.
- And 65% are disappointed when a brand they’ve purchased takes a strong stand on a political issue.
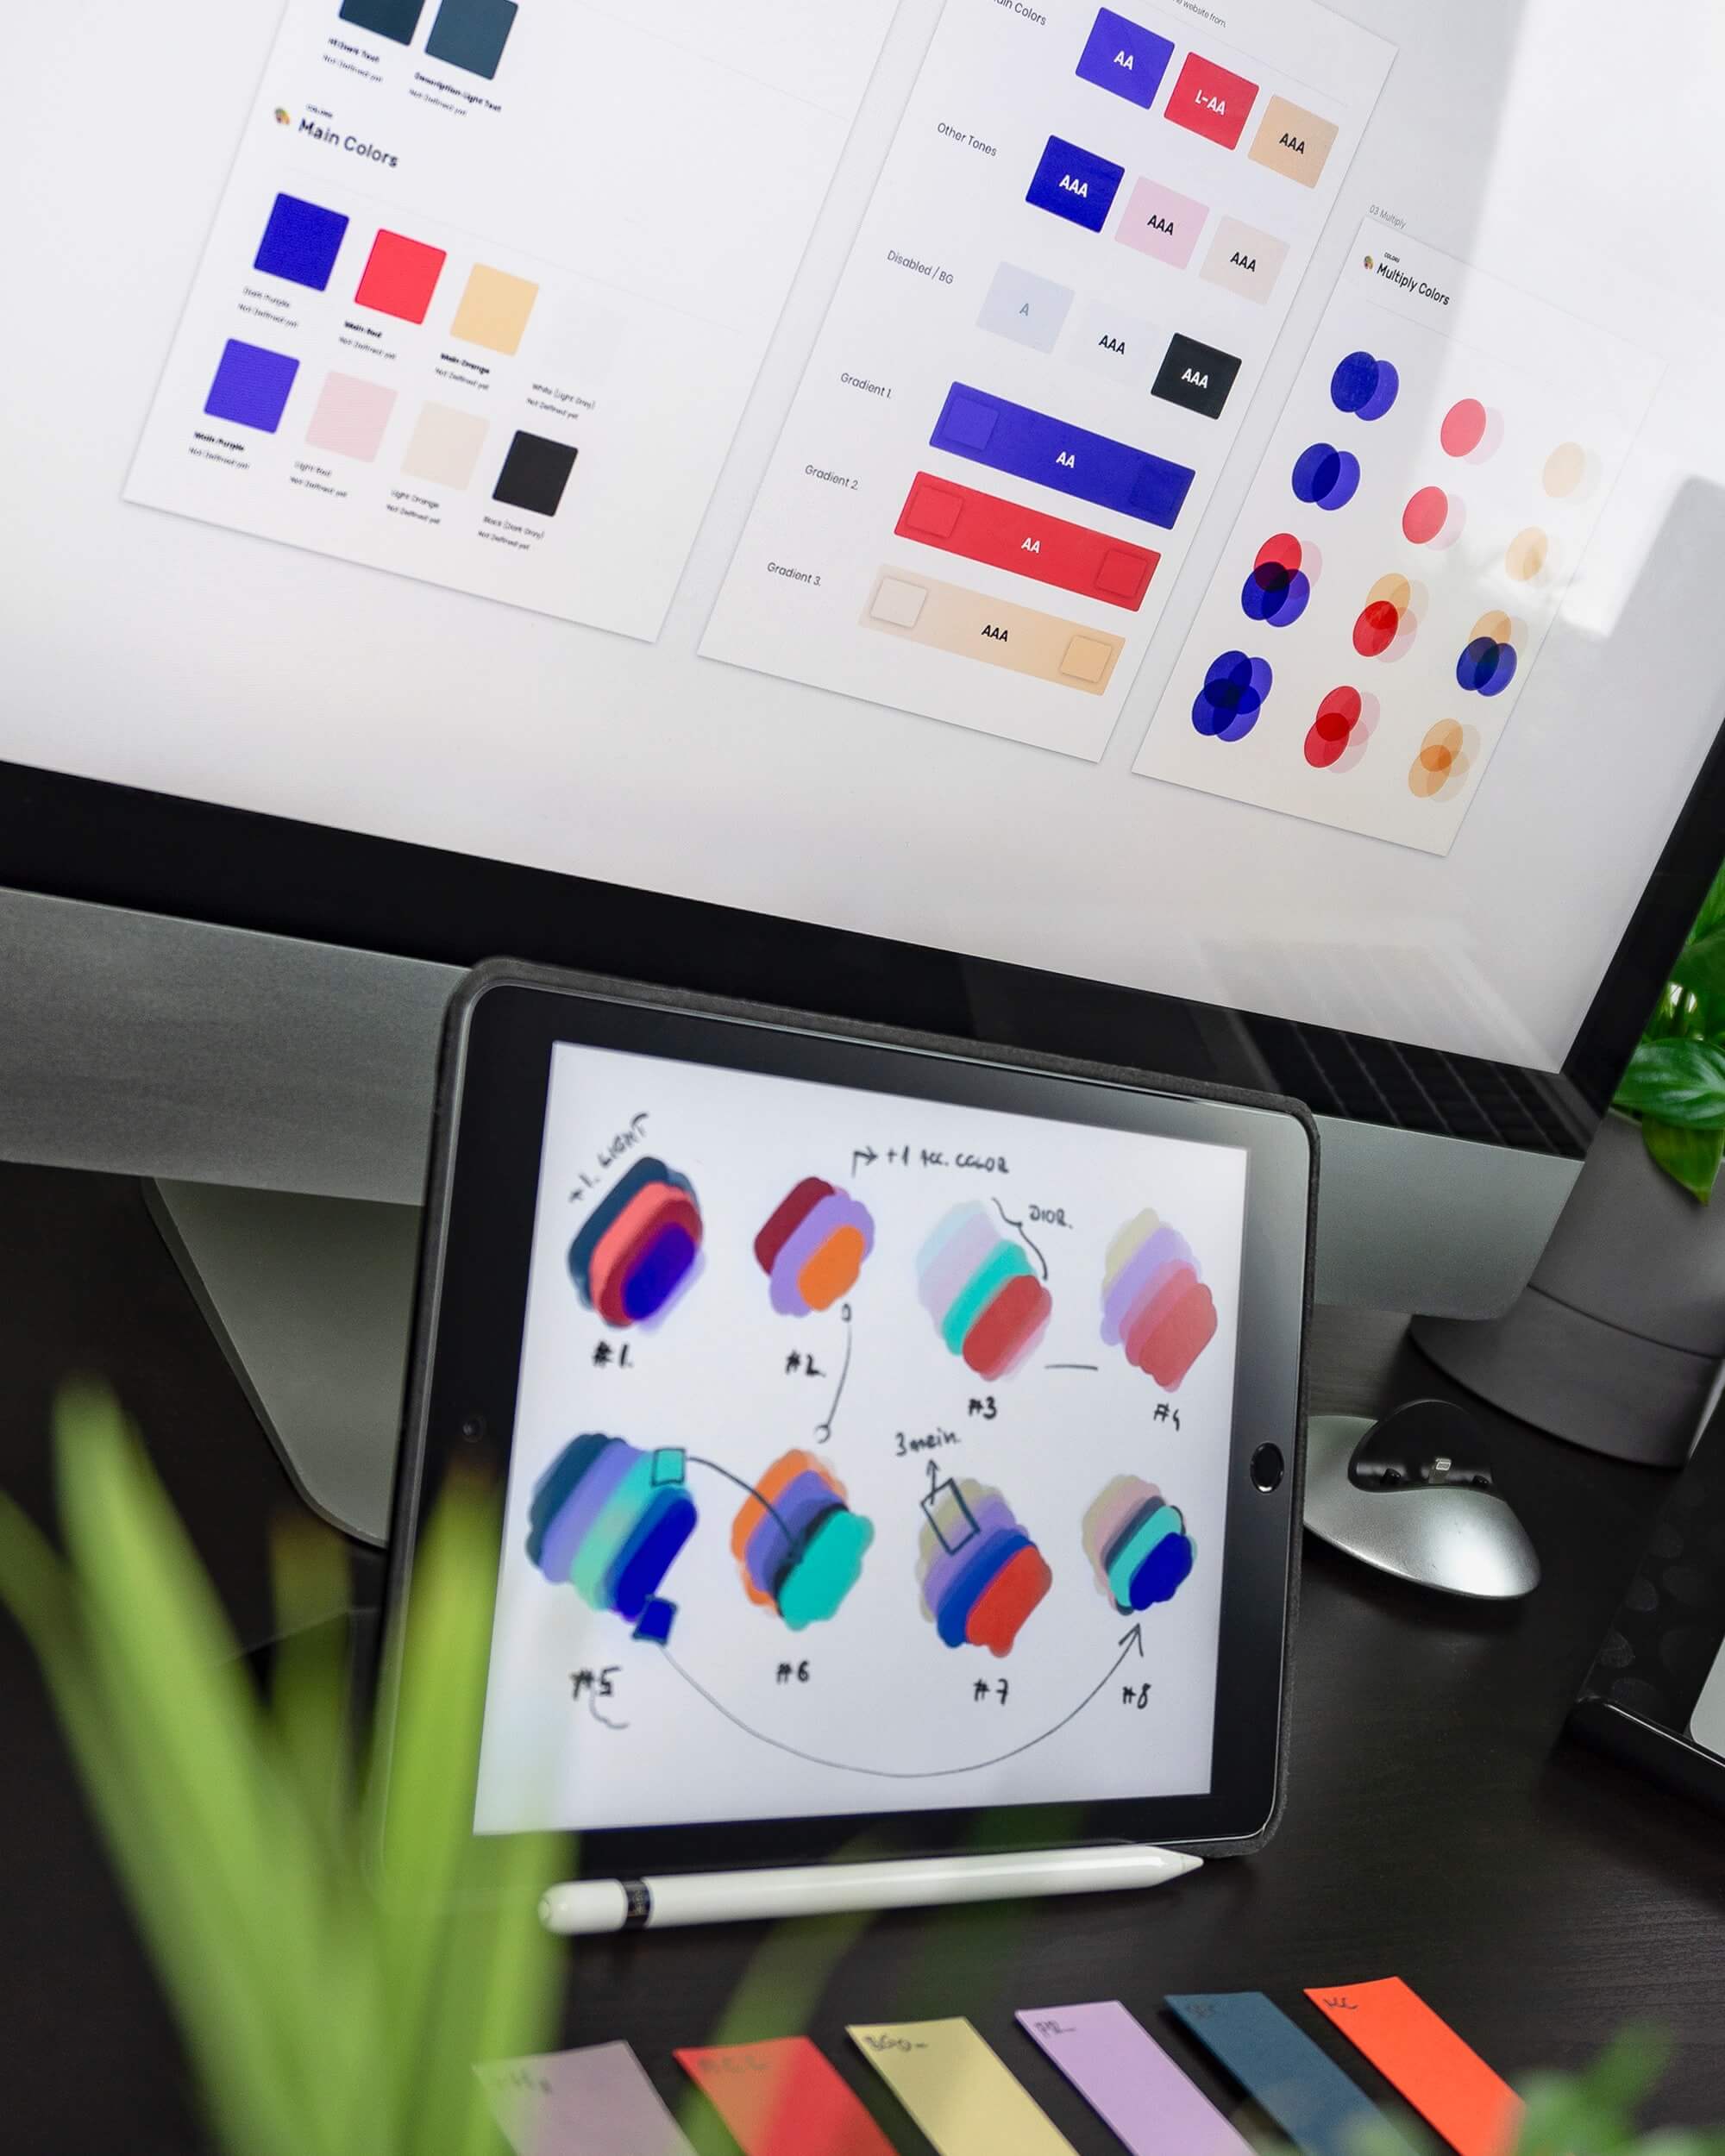
Color Branding Statistics
With 93% of consumers focusing on brand color, it definitely pays to be aware of what your brand colors say to your audience.
Customers take one look at your branding — and within 90 seconds — they’ve formed a subconscious judgment of your product or service. And would you believe that 62% to 90% of that is based on color alone??
When your brand colors are well chosen and consistent across your marketing channels, you can improve brand recognition by over 80% — this includes visual content — images, graphics and video.
So why is color so important?
8 out of 10 consumers see color as an indispensable part of brand recognition. Colors connect your brand with what you want your customers to feel (or think about) whenever they see your marketing content…
- Blue or Aqua — Serenity, Strength, Reliability (HP, Twitter, WordPress)
- Red — Passion, Boldness, Hunger (Target, Netflix, Pinterest)
- Orange — Confidence, Creativity, Enthusiasm (Nickelodeon, Amazon)
- Yellow — Positivity, Clarity, Warmth (IKEA, Snapchat, Subway)
- Green — Nature, Connection, Relaxation (Starbucks, Whole Foods)
- Purple — Wisdom, Uniqueness, Mystery (Curves, Yahoo, Hallmark)
- Black — Power, Timelessness, Stability (Nike, Chanel, CBS)
- Grayscale — Balance, Neutrality, Calm (Apple, Nike, Wikipedia)
Thoughts matter, too — but how consumers feel about different colors is ultimately what will make the biggest difference in your brand’s impact.
People are also attracted to their favorite colors…
So take note that blue is the favorite color of 57% of men and 35% of women, and green and purple share the second-place spot — both favored by 14% of consumers.
Color psychology also plays a role when consumers make a decision to purchase. As a brand color, red not only stimulates appetite (we’re looking at you, McDonald’s 🙂 but can also increase heart rate and blood pressure. Knowing this, red is not an ideal choice for a health spa or doctor’s office.
Share with me in the comment section below… what do you want your audience to feel when they see your branded content?
Logo Branding Statistics
Logo recognition is big business — consumers immediately know at a glance where a product is from if the logo is well-designed. In fact, a good logo is so important, when small business owners were surveyed on logo branding, 67% of them said they were willing to pay $500 for a professional logo design and 18% were willing to pay $1,000.
That’s a big expense for a little bit of design. But the importance of the logo makes it worth it.
When you’re starting your business, a business name is also important to your overall branding strategy, but 9% of brands surveyed chose not to include it in their company logo.
As we learned above, color is important to any brand… and when it comes to color in logo design, 95% of top brands choose to use only two colors…
- 35% use blue in their logo
- 30% use red
- 23% stick with grayscale or black & white
- 20% use yellow
- 7% use green
- And only 1% use purple.
Your logo is another chance to express your brand’s personality using color, shape and style. And if you’re considering using other brands’ successful designs to get more brand recognition, it will only get you so far — a swoosh doesn’t make everything better.
So tell me below, what qualities do you want your audience to notice about your business first?
Content Branding Statistics
For 80% of consumers, authenticity in content is the main factor in their decision to follow or engage with your brand (are you seeing the trend that authenticity is important?)… 70% would rather learn about your brand through articles and blog content than with ads.
Authentic content is so important that nearly 8 out of 10 people want to see you going out of your way producing custom (not generic) information. A blanket approach might appeal to a bigger audience, but it won’t resonate deeply enough to make you stand out.
Over half of consumers don’t trust any branded content they see online, which is a discouraging statistic for the 62% of millennial marketers who believe online content will help them build brand loyalty.
It’s also probably why 56% of online consumers see most branded content as “irrelevant.”
Fortunately, there’s a way around that — 64% of consumers say they’ve made a purchase after watching a branded video… the fast-growing medium that makes visual branding and personalization easier than ever.
I wanna know… when was the last time you reached out to your audience with a video?
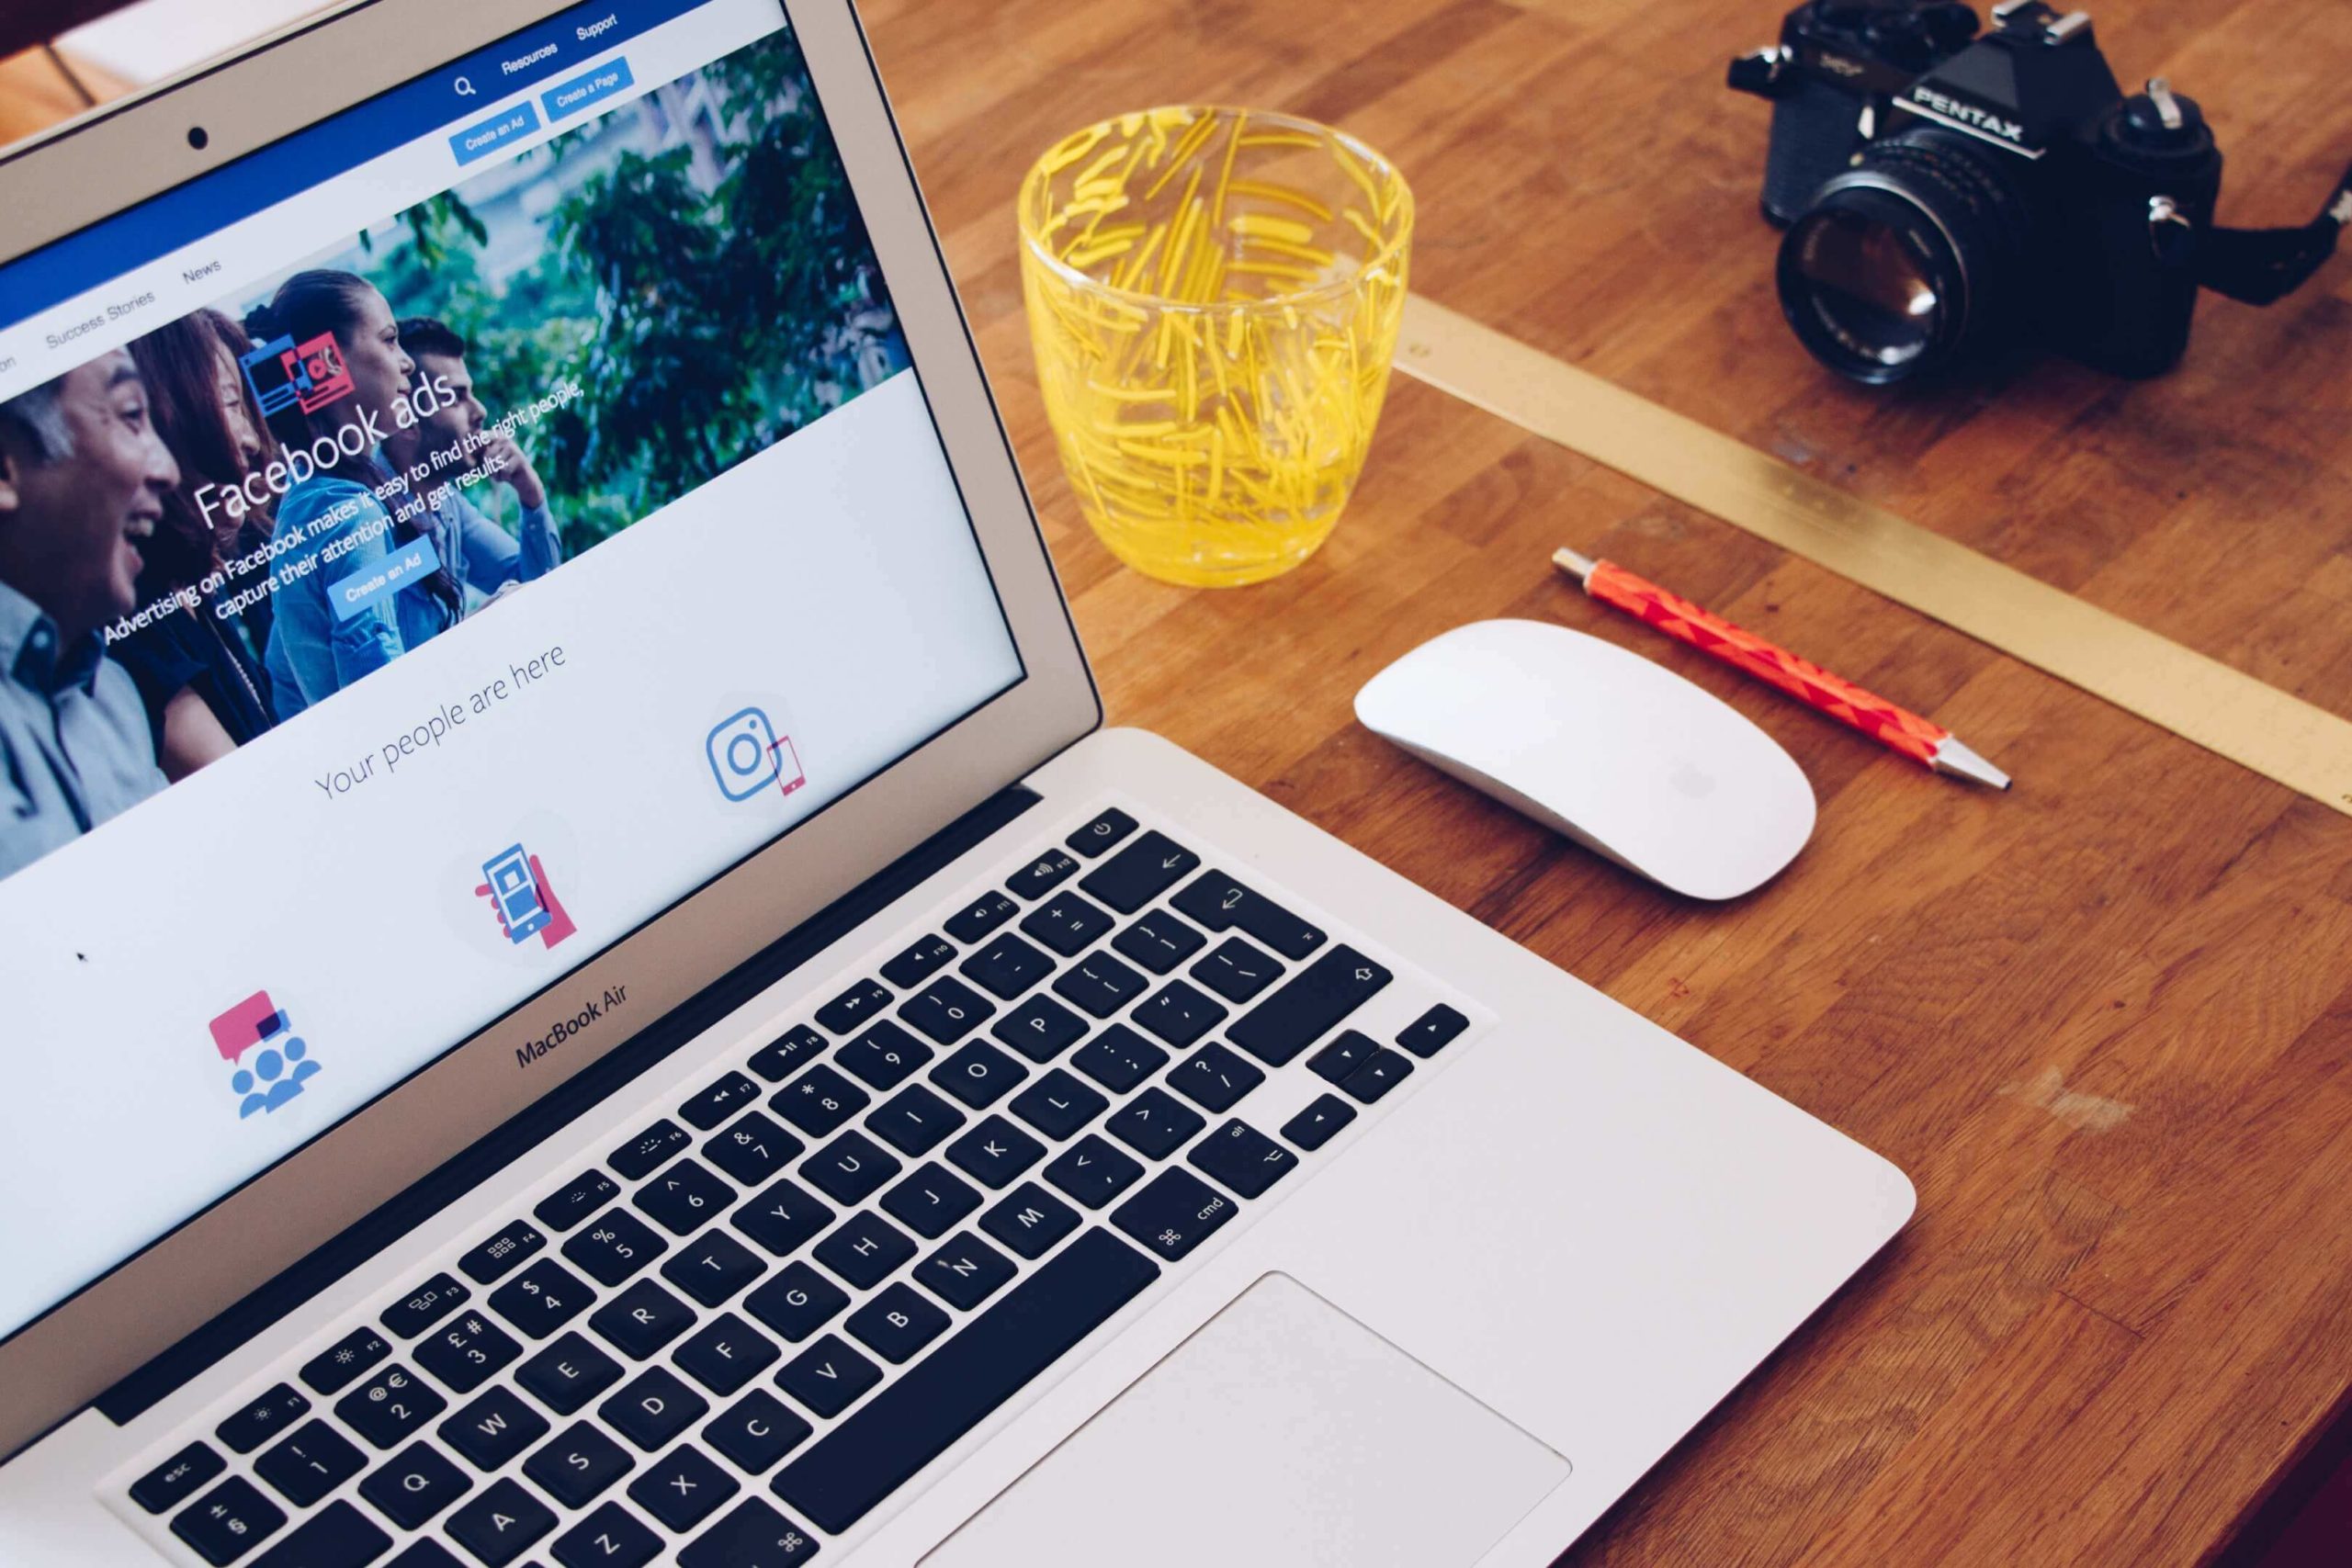
Social Media Branding Statistics
When it comes to social media, at least half of consumers follow 1 to 4 brands, 26% follow 5 to 9, 22% follow 10 or more and 3% follow none.
More than 40% of consumers on social media use it to learn more about brands and over half interact with brands on social media more than once a month. Which goes to show that if they like what they see, they’re more likely to follow…
- 15% follow brands to get notifications on special deals and promotions
- 12% follow brands to be notified of new products or services
Twitter has the highest purchase rate over all other social networks at nearly three-quarters (72%) of customers purchasing from brands they follow on the platform.
But before you run over to Twitter to bump up your posting, keep this in mind…
- 45% say they’ll unfollow a brand that overdoes it on self-promotion
- 34% will unfollow a brand if it uses automated messaging
- 19% will unfollow a brand for not using hashtags correctly
It’s well known that some social media platforms get more brand attention than others, typically based on user preference…
- Facebook is the favorite for 38% of consumers who follow brands
- 19% prefer Twitter
- 15% prefer YouTube
- 10% prefer Google
- Fewer than 10% follow brands on LinkedIn, Instagram, Pinterest, etc.
When it comes to sharing brand messages, Facebook and Twitter users are 40 times more likely to share visual content than text-only posts. And branded messages are 24 times more likely to get shared on personal accounts than on branded ones.
So there’s a fine line between salesy and sincere & authentic…
Branded content shared by your employees also gets 8 times the engagement of content on brand accounts, so get your team to follow you and share the goodness!
If Pinterest is your jam, you can take heart knowing 78% of users want to see more branded content on the platform.
Now, when it comes to customers messaging your business on social media, it’s important to respond sooner than later — 77% of Twitter users feel more favorable toward brands that reply to their tweets. So make sure if you’re running multiple accounts, you’re checking often for messages and likes.
Employer Branding Statistics
Over half (55%) of recruiters want to invest more in employer branding to accomplish the following goals…
- Attract high-quality employees looking for healthy company culture
- Attract consumers who favor brands they’d want to work for
Employer branding and workplace culture aren’t just buzzwords to younger generations. 68% of Millennials check out a brand’s social media sites to check out their employer branding. They want to learn more about who they’ll work for and how the culture contributes to the company’s success.
And don’t forget about company reviews… they’re closely examined by potential employees as well. Over half (55%) of job seekers say they’ve bailed on a job application after reading a negative review about the company… but the good news is 70% changed their mind when the employer responded constructively to a negative review.
Currently, Facebook is still the number one platform for employer branding research. But wherever you build your employer brand — online and off — make it a priority to engage with your audience and keep your content up-to-date.
High-quality videos also give visitors to your website or social feeds an easy way to get to know you better, and they’re a great way to showcase your location, your team and your leadership.
Aside from increasing your profits from sales to socially conscious consumers, employer branding can cut the cost of hiring new talent by 43%. That makes it worth paying attention to.
Rebranding Statistics
While the cost of not rebranding when it makes sense to do so is typically higher in the long run, the cost of rebranding can still cost 5-10% of your annual marketing budget.
And did you know that the average corporation changes its brand identity in some way every 7 to 10 years? Sometimes this works well (but not always).
Here are a few of the common reasons behind a company’s decision to rebrand…
- Appealing to a global audience — 56% of small businesses have international customers
- Repositioning to attract a larger audience — Walmart’s slogan change in 2007 made it the world’s largest corporation by revenue in 2010
- Change in management — Almost 50% of the largest American companies will change CEOs within the next four years
- Development of corporate identity — GAP tried rebranding its iconic logo and ended up changing it back in just 5 days after public outcry
- Bad reputation — When Super Size Me came out (2014), McDonald’s introduced earthy greens to its brand and added salads to the menu
Here’s the thing, your brand is the sum total of the impressions customers have gained from their interactions with your company.
Part of it is their visceral response to your branded material and part is how you respond to their questions, concerns and expectations.
77% of consumers neither expect nor want to have a relationship with your brand, but they still expect you to take their feedback seriously.
And of that 23% who do want a relationship with your brand, 64% base it on shared values. Branding that doesn’t speak to those values is wasted on them.
So which branding statistics will have the biggest impact on your marketing?
Because… wow, that’s a lot of data!
Now that you’ve learned all 77 branding statistics above, which stood out to you?
And how might they influence your branding decisions?
Which statistics validate branding decisions you’ve made so far?
And which have got you thinking of ways to clarify your message?
I’d love to hear about your progress in creating a strong brand identity and sharing it with your audience.
But before you go…
Check out my Free Masterclass!… The 3 Tweaks to Turn Your Website into a Lean, Mean, Money Making Machine!

Inside you’ll discover…
- How an easy, non-technical, home page issue could be why you aren’t getting new leads.
- How to use “micro commitments” to double your opt-in rates.
- The simple tweak to keep people on your page longer.
- 5 “pro” design tips to position you as an authority and attract your ideal clients.
Just click here for instant access!


Leave a Comment